Deutsch

Healthchecks 2.0 new

HealthchecksHealthchecks

Know what is running – from outside and from inside.

IPv64.net health checks monitor websites, APIs, servers, ports, certificates, DNS records, domains and cron jobs. Measured online from locations in Germany, locally on your home network with Node64, or both together – and you know right away when something fails.

11 check types Nuremberg & Falkenstein online, local, hybrid 13 notification channels API v2 Made in Germany

Create a free account Check types Documentation Server status
Still using the previous health checks? Healthchecks 1.0 will be shut down on 22 November 2026. Create your checks here before then – after logging in you find the new health checks on this page.

Why Healthchecks 2.0?

Uptime monitoring with your ipv64.net account – operated in Germany.

Measured from outside

Online checks run from the IPv64 locations Nuremberg and Falkenstein. If only some locations report a problem, you see “partially down” instead of a false alarm.

From inside with Node64

With Node64 you also monitor devices and services on your home network – locally, without port forwarding. In hybrid mode you check the same service from inside and outside at once.

Notified wherever you are

E-mail, SMS, IPv64 App, Telegram, Discord, Slack, Microsoft Teams, Pushover, ntfy, Gotify, Matrix, webhook or your own SMTP server – selectable per check, with reminders while an incident lasts.

Maintenance and incidents

Maintenance windows silence alerts during planned work. Every incident is recorded with start, end and reason; dependent checks do not alert twice.

Push for cron jobs and backups

Your script calls an address when it is done. If the call does not arrive, the check alerts you – ideal for backups, cron jobs and scripts.

DNS failover and API

Every check can switch your domain to a backup target in DNS failover. With API v2 you create checks automatically and read their states.

Eleven check types

TypeChecks
HTTP(S)Website or service answers with an allowed status code
KeywordText appears in the response – or not
JSON (API)Conditions on a JSON response
DNSDNS record exists or has the expected content
Ping (ICMP)Host answers, packet loss and latency
TCPConnection to a port, optionally with send/expect and TLS
PortPort is open – or explicitly closed
CertificateTLS certificate valid and long enough
WHOIS / RDAPRegistration data of a domain, IP address or AS number
Push / Heartbeatyour system checks in regularly
Docker containerContainer is running and healthy (local only, with Node64)

Who measures?

ExecutionWho measuresTypical for
Onlinethe IPv64 locations Nuremberg and Falkensteinpublic websites, certificates, ports from outside
Localone or more of your Node64 installationsdevices and services on your home network
Hybridnodes and IPv64 locations at the same timeself-hosted services that should also be reachable from outside

Free accounts measure online from one location per check, all other account classes from both. Local measurements of your nodes never count against your account class limits. Prices & account classes

Everything at a glance with Node64
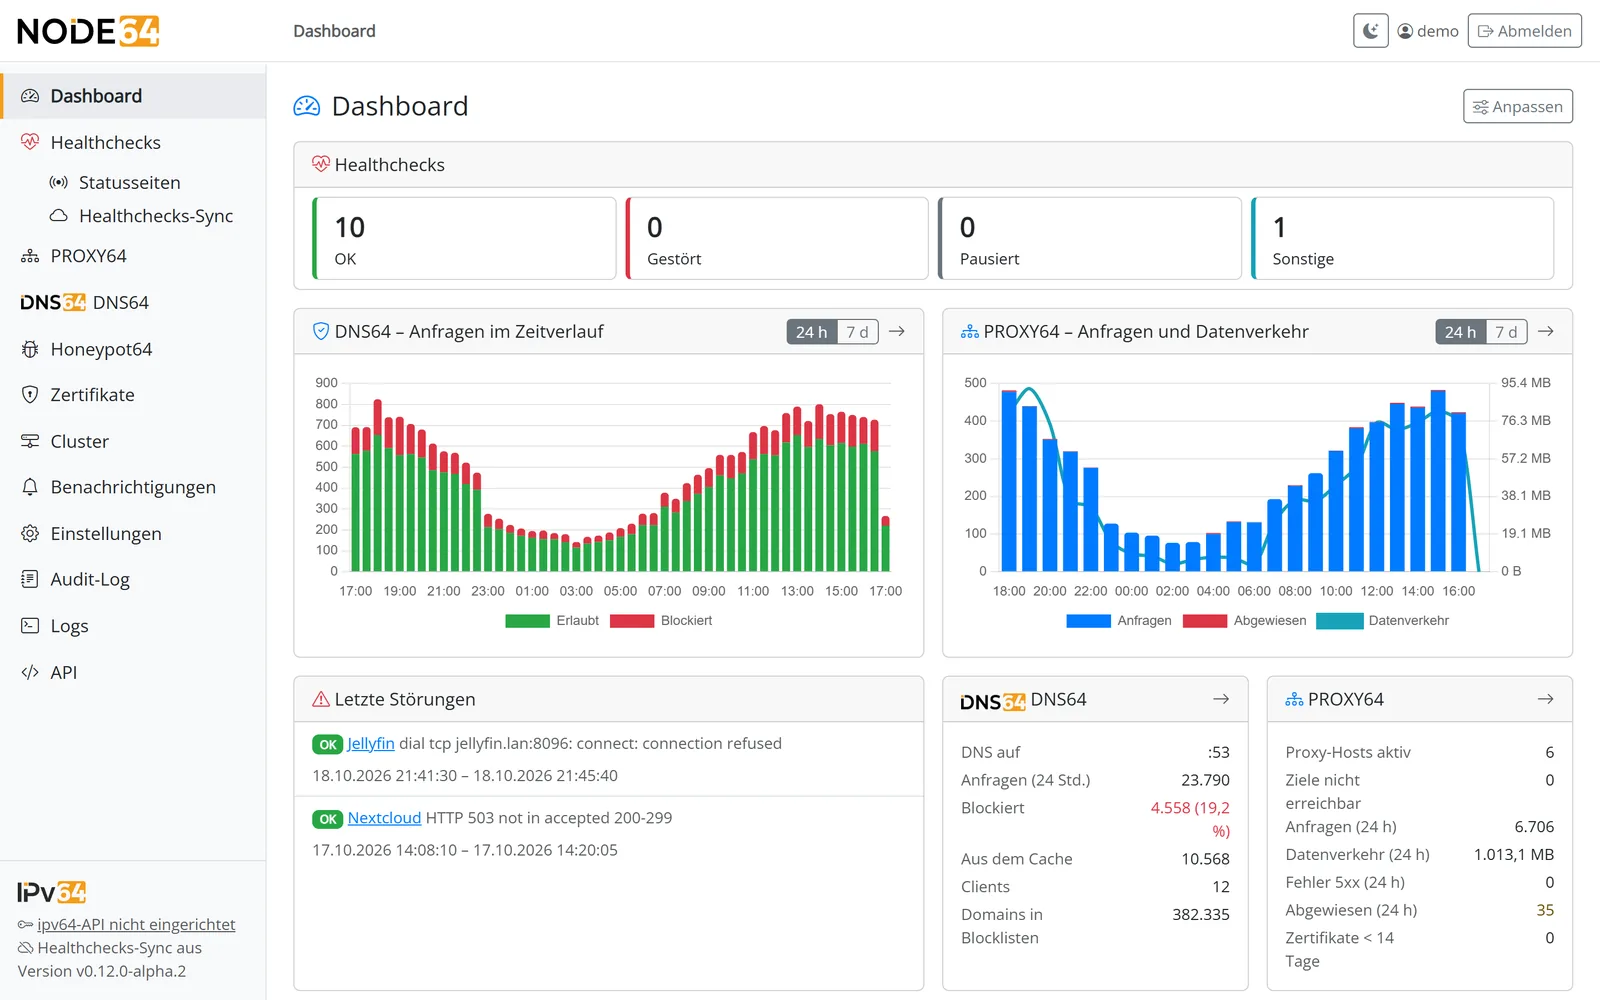
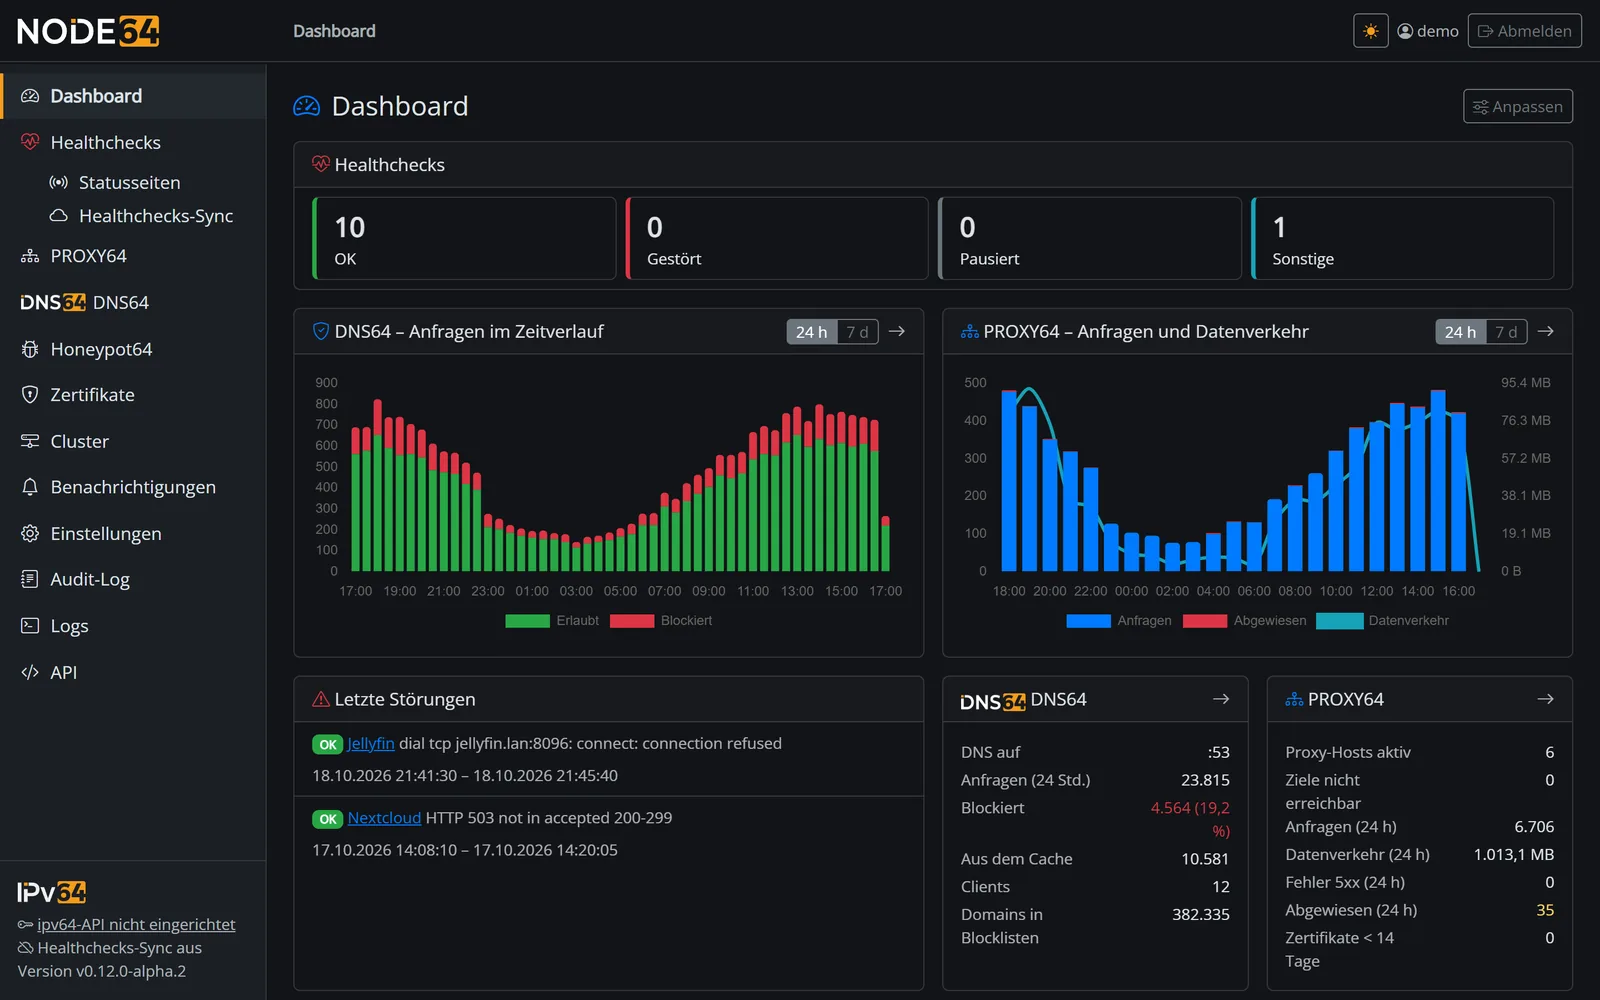
Node64 dashboard with health checksNode64 dashboard with health checks

If you link Node64 with your account, your checks show up there too – with history, local measurements and Proxmox and Docker monitoring. More about Node64

Status pages for your visitors
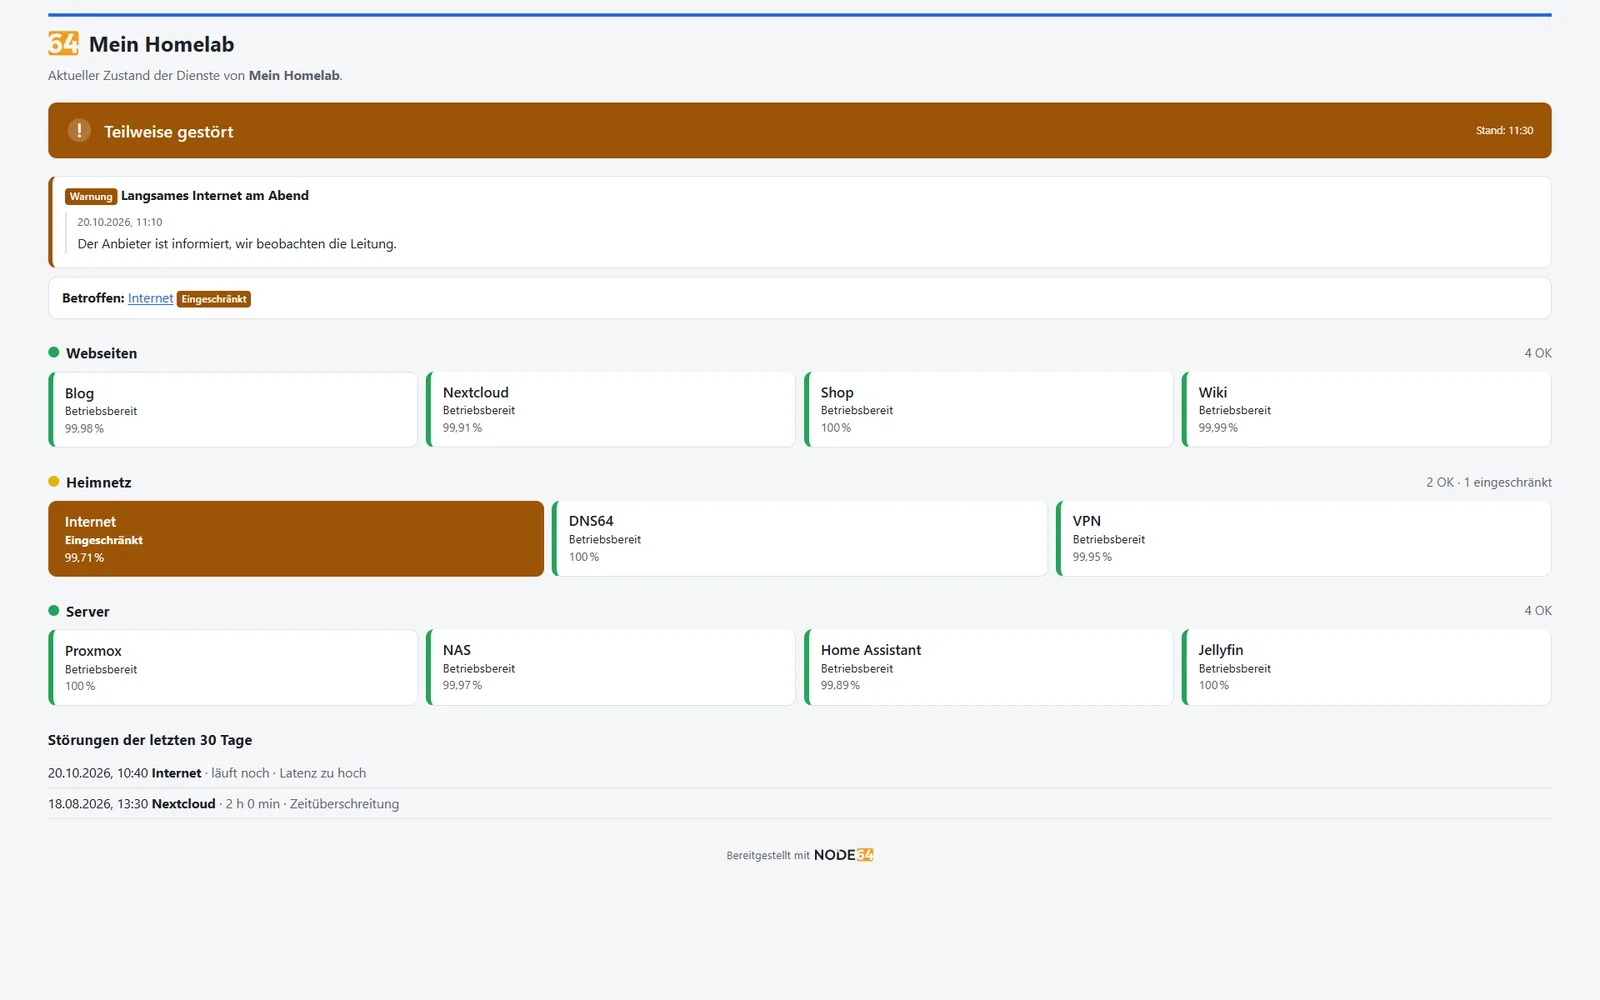
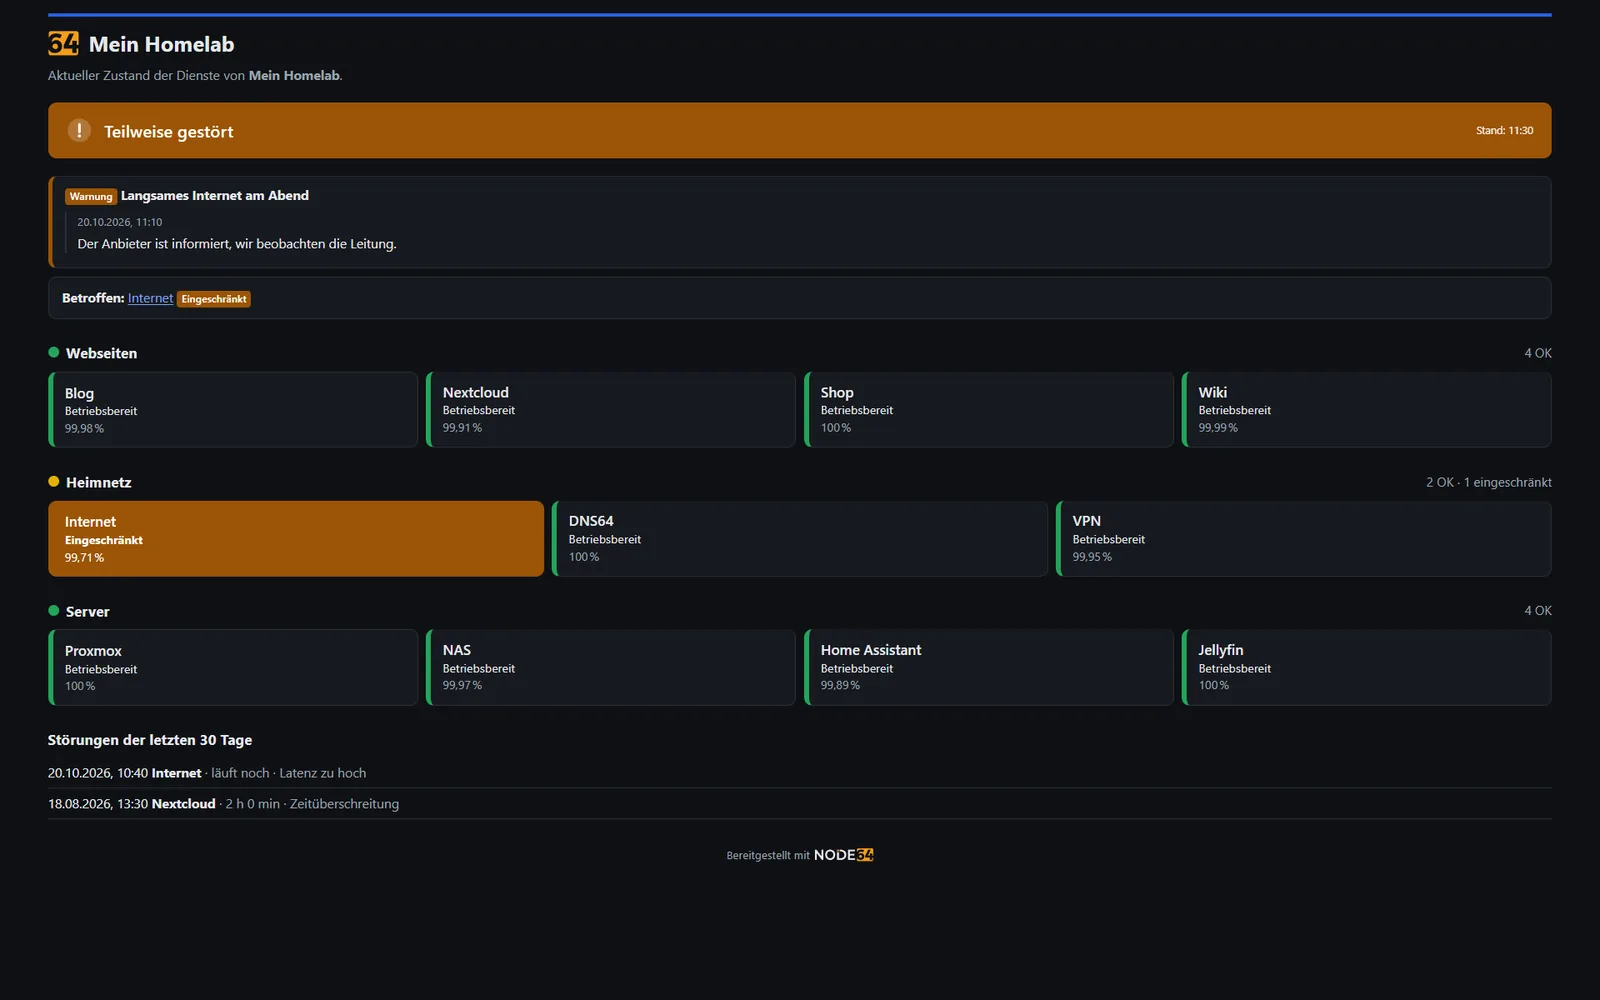
Public status page made from Node64 health checksPublic status page made from Node64 health checks

With Node64 you turn your checks into a public status page – on your own domain if you like.

Monitored in two minutes

  1. Create a free ipv64.net account.
  2. Under Healthchecks → Healthchecks 2.0 create a check: choose type, target and notification.
  3. Done – optionally link Node64 to measure on your home network too.
Create a free account Documentation Node64

Already have an account? Log in at the top – then you manage your checks here.